Bagaimana anda mencipta strategi dagangan langkah demi langkah?
Untuk mencipta strategi dagangan langkah demi langkah, mula-mula tetapkan matlamat kewangan dan risiko yang anda sanggup tanggung, kemudian pilih pasaran dan rangka masa yang sesuai dengan jadual anda. Seterusnya, reka peraturan masuk dan keluar yang jelas, termasuk tahap stop-loss dan take-profit, dan tentukan berapa banyak yang anda akan risikokan bagi setiap dagangan menggunakan formula pengukuran saiz posisi yang ringkas. Uji semula peraturan anda pada data sejarah, uji ke hadapan pada akaun demo, dan perhalusinya berdasarkan prestasi sebenar. Akhir sekali, dokumentasikan pelan dagangan anda, mula berdagang secara langsung dengan saiz kecil, dan simpan jurnal terperinci supaya anda boleh menambah baik strategi dari semasa ke semasa.
Langkah 1 – Jelaskan matlamat dan toleransi risiko anda
Strategi anda bermula dengan mengetahui apa yang anda inginkan dan apa yang anda mampu rugi. Tentukan sama ada matlamat utama anda ialah pendapatan jangka pendek, pertumbuhan modal jangka panjang, atau kepelbagaian bersama pelaburan lain. Ramai pemula menghadkan risiko setiap dagangan kepada 0.5–2% daripada ekuiti akaun; contohnya, pada akaun 1,000 dolar dengan risiko 1%, kerugian maksimum bagi setiap dagangan ialah 10 dolar. Tetapkan ambang drawdown maksimum (contohnya, 10–20%) di mana anda akan menghentikan dagangan dan menyemak semula sistem. Nombor yang jelas menjadikan keputusan kemudian lebih objektif dan lebih mudah diikuti.
Langkah 2 – Pilih pasaran dan rangka masa anda
Pilih pasaran yang anda fahami dan boleh pantau: saham, forex, indeks, kripto, komoditi, atau emas (XAUUSD). Pedagang harian sering menggunakan carta 1, 5, atau 15 minit dan mungkin membuat banyak dagangan setiap sesi, manakala pedagang swing lebih suka carta 4 jam atau harian dan memegang posisi selama beberapa hari. Jika anda mempunyai pekerjaan sepenuh masa, dagangan swing atau position biasanya lebih realistik berbanding scalping. Sebagai contoh, seorang pemula mungkin hanya fokus pada EURUSD pada carta 4 jam, atau pedagang saham mungkin menggunakan carta harian komponen indeks bermodal besar. Mengecilkan skop pasaran anda memudahkan ujian dan pelaksanaan.
Langkah 3 – Tentukan gaya dagangan dan kelebihan anda
Kelebihan anda ialah sebab dagangan anda sepatutnya mempunyai jangkaan pulangan yang sedikit positif dari semasa ke semasa. Gaya biasa termasuk mengikut trend, dagangan julat, dagangan breakout, dan mean reversion. Bagi dagangan trend, kelebihan anda mungkin ialah “dagang hanya mengikut arah purata bergerak tempoh 200 dan masuk semasa pullback.” Bagi pedagang julat, ia boleh jadi “beli berhampiran sokongan dan jual berhampiran rintangan dalam pasaran mendatar, dengan tahap pembatalan yang jelas.” Selaraskan gaya anda dengan perangai anda; contohnya, jika keputusan pantas menyebabkan anda tertekan, dagangan swing yang lebih perlahan sering lebih sesuai berbanding scalping yang sangat singkat.
Langkah 4 – Tukarkan kelebihan anda kepada peraturan masuk yang tepat
Terjemahkan idea anda kepada syarat masuk yang khusus dan tidak kabur. Contoh trend-following yang ringkas pada carta 1 jam mungkin:
- Hanya beli apabila harga berada di atas SMA ringkas tempoh 200.
- Tunggu pullback ke SMA tempoh 20 yang menghormati zon sokongan sebelumnya.
- Masuk belian apabila candlestick menaik terbentuk di zon itu dan RSI melintasi ke atas 50.
Kuncinya ialah pedagang lain boleh melihat carta yang sama dan tahu dengan tepat sama ada terdapat setup yang sah atau tidak. Elakkan menggunakan terlalu banyak indikator pada permulaan kerana ia meningkatkan risiko curve-fitting dan menyukarkan anda memahami apa yang mendorong hasil anda.
Langkah 5 – Tentukan peraturan keluar, stop-loss, dan take-profit
Keluar menentukan profil risiko/ganjaran anda. Tentukan di mana anda akan meletakkan stop-loss (contohnya, di bawah swing low terakhir dalam aliran menaik) dan bagaimana anda akan mengambil untung. Pendekatan biasa ialah menggunakan nisbah ganjaran-kepada-risiko yang tetap, seperti 1:2: jika stop anda 50 pip atau 0.50 dolar jauhnya, take-profit anda ialah 100 pip atau 1.00 dolar jauhnya. Pendekatan lain ialah menggunakan trailing stop yang mengikuti trend, seperti meletakkan stop di bawah purata bergerak yang bertindak sebagai sokongan dinamik. Pilih satu kaedah utama dan kekalkan konsistensinya semasa anda menguji supaya anda dapat mengukur keberkesanannya.
Langkah 6 – Bina model saiz posisi dan pengurusan risiko
Saiz posisi menghubungkan peratus risiko anda kepada lot atau saham sebenar. Formula mudah ialah:
Jika anda merisikokan 20 dolar bagi setiap dagangan dan stop anda 0.40 dolar jauhnya, anda boleh membeli 50 saham (20 ÷ 0.40 = 50). Dalam forex, jika anda merisikokan 30 dolar dan stop anda 30 pip, setiap pip sepatutnya bernilai 1 dolar; saiz lot anda dipilih dengan sewajarnya. Gabungkan ini dengan peraturan peringkat portfolio, seperti “jangan risikokan lebih daripada 5% keseluruhan pada semua dagangan terbuka” dan “hentikan dagangan untuk hari itu selepas tiga kerugian berturut-turut.” Pengurusan risiko yang kukuh sering lebih penting daripada mempunyai kadar kemenangan yang tinggi.
Langkah 7 – Uji semula strategi dagangan anda pada data sejarah
Ujian semula memeriksa bagaimana peraturan anda akan berprestasi pada masa lalu. Gunakan alat replay carta atau perisian backtesting untuk mengaplikasikan strategi anda kepada data harga sejarah tanpa mengubah peraturan di tengah-tengah ujian. Sasarkan sekurang-kurangnya 50–100 dagangan bagi setiap pasaran dan rangka masa untuk mendapatkan sampel yang bermakna. Jejaki metrik seperti:
- Kadar kemenangan (peratus dagangan yang menang)
- Nisbah ganjaran-kepada-risiko purata
- Faktor keuntungan (keuntungan kasar ÷ kerugian kasar)
- Drawdown maksimum
Sebagai contoh, strategi dengan kadar kemenangan 45% dan purata ganjaran-kepada-risiko 1:2 masih boleh menguntungkan kerana setiap kemenangan kira-kira dua kali saiz setiap kerugian. Konsistensi merentasi tempoh masa yang berbeza lebih penting daripada satu segmen backtest yang luar biasa.
Langkah 8 – Uji ke hadapan pada demo atau akaun mikro
Ujian ke hadapan bermaksud mengaplikasikan peraturan anda secara langsung dalam pasaran semasa menggunakan modal demo atau posisi sebenar yang sangat kecil. Ini menguji pelaksanaan, slippage, kesan spread, dan psikologi secara masa nyata. Cuba kumpulkan lagi 50–100 dagangan tanpa perubahan besar pada peraturan anda, kemudian bandingkan prestasi dengan backtest anda. Jika hasilnya secara umum serupa, strategi itu mungkin kukuh; jika ia sangat berbeza, ia mungkin menunjukkan over-optimization, kesilapan pelaksanaan, atau keadaan pasaran telah berubah. Ujian ke hadapan juga mendedahkan sama ada anda benar-benar boleh mematuhi peraturan di bawah tekanan masa nyata.
Langkah 9 – Analisis prestasi dan perhalusikan strategi
Gunakan kedua-dua statistik dan jurnal dagangan untuk melihat apa yang berkesan dan apa yang tidak. Cara mudah untuk menilai expectancy ialah:
Sebagai contoh, jika kadar kemenangan anda 45%, purata kemenangan 200 dolar, dan purata kerugian 100 dolar, expectancy ialah 0.45×200−0.55×100=90−55=35 dolar bagi setiap dagangan. Fokuskan penambahbaikan pada faktor utama: mungkin waktu tertentu atau keadaan pasaran tertentu berprestasi buruk dan perlu ditapis. Buat perubahan secara berkumpulan dan uji semula, bukannya mengubah suai parameter selepas setiap siri kerugian.
Langkah 10 – Dokumentasikan pelan dagangan anda
Tukarkan strategi anda menjadi sebuah pelan dagangan bertulis yang merangkumi:
- Pasaran dan rangka masa
- Penerangan setup dan peraturan masuk
- Stop-loss dan kaedah take-profit
- Peraturan saiz posisi dan had risiko maksimum
- Penapis berita dan masa anda mengelakkan dagangan
- Proses semakan harian dan mingguan
Pelan itu harus cukup ringkas untuk dibaca sebelum setiap sesi tetapi cukup terperinci supaya orang lain juga boleh melaksanakannya. Kekalkan jurnal dengan tangkapan skrin, sebab bagi setiap dagangan, dan sama ada anda mengikut pelan. Lama-kelamaan, dokumentasi ini menjadi gelung maklum balas untuk penambahbaikan berterusan dan membantu anda kekal berdisiplin semasa tempoh emosi.
Langkah 11 – Mula secara beransur-ansur dan tingkatkan saiz dengan berhati-hati
Setelah backtesting dan forward-testing anda kelihatan konsisten, anda boleh mula berdagang secara langsung dengan saiz posisi kecil. Pertimbangkan untuk bermula dengan separuh atau bahkan suku daripada risiko yang anda rancangkan bagi setiap dagangan (contohnya, 0.5% bukannya 2%) sementara anda menyesuaikan diri dengan emosi wang sebenar. Teruskan menjejak metrik utama—kadar kemenangan, drawdown, faktor keuntungan, dan expectancy—secara bulanan atau suku tahunan. Hanya tingkatkan saiz apabila kedua-dua hasil anda dan tingkah laku anda (tiada revenge trading, tiada melanggar peraturan) kekal stabil sepanjang sampel dagangan yang munasabah, seperti 3–6 bulan data langsung.
Contoh: strategi pullback purata bergerak yang ringkas
Ini ialah strategi swing trading asas untuk carta harian:
- Pasaran: pasangan forex utama atau indeks yang cair.
- Penapis arah: Dagang belian hanya apabila harga berada di atas SMA 200 hari; jual hanya apabila di bawah.
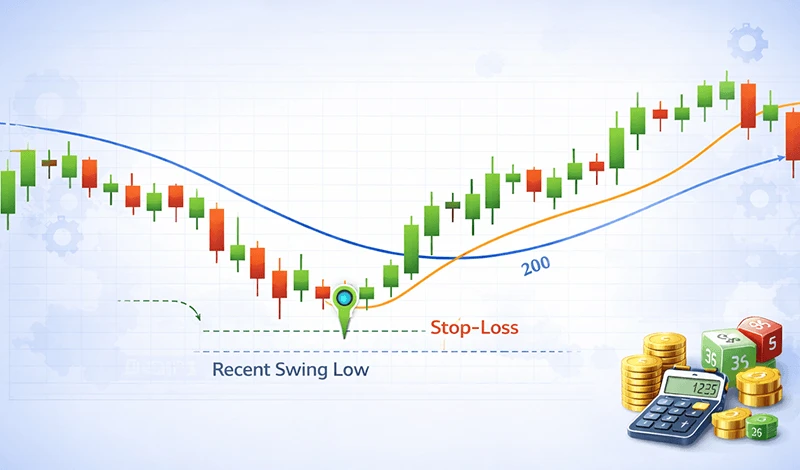
- Masuk: Tunggu harga menarik balik ke SMA 20 hari dan menunjukkan corak candlestick pembalikan (contohnya, pin bar) mengikut arah trend utama.
- Stop-loss: Letakkan di bawah swing low terkini untuk dagangan belian (atau di atas swing high untuk dagangan jual).
- Take-profit: Tetapkan pada 2 kali jarak stop (nisbah ganjaran-kepada-risiko 1:2).
- Risiko: 1% daripada akaun setiap dagangan, maksimum 3 dagangan terbuka.
Set peraturan ini mudah, senang diuji semula, dan merupakan titik permulaan yang baik untuk pemula memahami bagaimana trend following berfungsi dalam amalan.
FAQ: mencipta strategi dagangan
1. Berapa lama masa yang diperlukan untuk membina strategi dagangan yang kukuh?
Ramai pedagang memerlukan beberapa minggu untuk mereka bentuk peraturan asas dan beberapa bulan untuk mengumpul cukup dagangan backtest dan forward-test. Proses ini bersifat iteratif: anda mereka, menguji, memperhalus, dan mengulang semula apabila keadaan pasaran berubah. Tergesa-gesa ke dagangan langsung tanpa asas ini biasanya membawa kepada keputusan emosi dan hasil yang tidak konsisten.
2. Adakah saya perlu kemahiran pengekodan untuk mencipta strategi dagangan?
Anda boleh membina dan menguji strategi dagangan diskresi hanya باستخدام platform carta dan backtesting manual. Pengekodan menjadi berguna untuk strategi algoritma atau frekuensi tinggi di mana anda perlu menguji beribu-ribu variasi secara automatik. Bagi kebanyakan pemula, ujian manual sistem berasaskan peraturan yang mudah pada beberapa pasaran sudah cukup untuk mula belajar dan membina keyakinan.
3. Apakah modal minimum untuk mula berdagang strategi?
Modal minimum sebenar bergantung pada saiz posisi minimum broker anda dan peraturan risiko anda. Contohnya, jika anda merisikokan 1% setiap dagangan dan mahu sekurang-kurangnya 10 dolar, anda memerlukan kira-kira 1,000 dolar dalam akaun anda. Sesetengah broker menawarkan akaun mikro atau sen, membolehkan pemula berlatih dengan jumlah yang lebih kecil sambil masih mematuhi risiko berasaskan peratusan. Bahagian penting ialah kerugian kekal mudah dikawal dari segi emosi dan kewangan.
4. Bagaimana saya tahu jika strategi saya terlalu dioptimumkan?
Tanda amaran overfitting termasuk hasil backtest yang sangat baik tetapi runtuh dalam forward-testing, peraturan yang terlalu kompleks dengan banyak parameter, dan kebergantungan berat pada satu tempoh data sejarah yang khusus. Untuk mengurangkan overfitting, kekalkan peraturan yang ringkas, uji pada beberapa tempoh masa dan pasaran yang sesuai, dan sahkan dengan data luar sampel. Jika prestasi kekal kukuh merentasi persekitaran yang berbeza, strategi itu lebih berkemungkinan mantap.
5. Bolehkah satu strategi berfungsi merentasi semua pasaran dan rangka masa?
Sesetengah konsep, seperti trend following atau mean reversion, boleh digunakan secara meluas, tetapi nilai parameter yang tepat sering perlu disesuaikan. Volatiliti, waktu dagangan, dan kecairan berbeza antara pasaran seperti forex, saham, dan kripto. Biasanya lebih baik untuk mengoptimumkan strategi bagi kombinasi pasaran dan rangka masa yang khusus, kemudian menguji dengan berhati-hati sama ada variasi juga berfungsi di tempat lain daripada menganggap ia boleh digunakan secara universal.
Kembali Kembali
